This report will allow you to evaluate the pace of which your business revenue is growing. By providing you with a clear understanding of growth over multiple periods of time.
1. Reports > Sales Growth Analysis (under Performance)
2. Start Date & End Date: The dates that are entered through these filters will coincide with the Previous Years(s) OR Previous Consecutive Periods that are chosen.
3. Previous Year(s): Will only look at the last years of your business growth during the time range you choose. It will also take into account the Number of Years you have chosen.

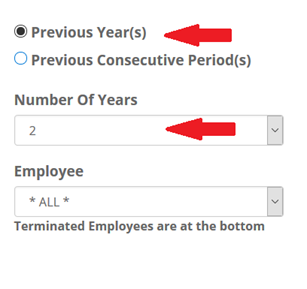
Example: Date Range is June 1st - September 30th, chose "Previous Year(s)", Number of Years is 3
You will be shown the revenue from June 1st - September 30th this year, last year, and the year before that.
4. Previous Consecutive Period(s): This will run the report for back-to-back time periods based on the date range that you choose

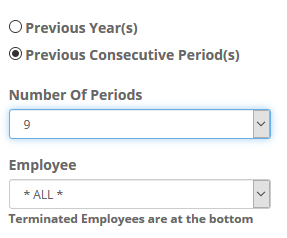
Example: Date range is September 8th - September 14th (7 days), chose "Previous Consecutive Period(s)", Number of Periods is 9.
It will show me September 8th - September 14th, September 1st - September 7th, August 25th - August 31st, and so on to show you 9 of those period spans in a row.
5. If you would like to see a specific employee's revenue, choose them from the drop-down
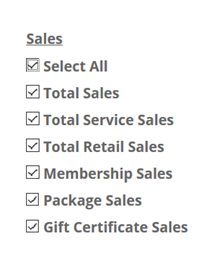
6. Once the time frames are chosen, move onto choose the data you'd like to include:

7. Click Run Report
- “I Need it now” will run the report immediately and display it on your screen/page as long as you do not exit out
- “I can wait for it” is designed for generating the report, (even if you exit from the page), then saving it to the saved reports folder in the top, right corner of your main Reports page.
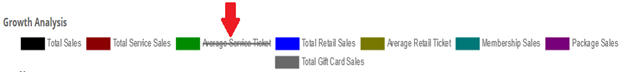
Sales Growth Analysis Graph
This report will include a graph that is intended to assist you in visualizing the trends in each type of sale. When looking at the graph you can choose to remove a sales filter from the set of data. Simply click on the sales filter that you want to remove from the graph within the color key. This will draw a line through it to let you know it is not included in the graph.

1. Reports > Sales Growth Analysis (under Performance)
2. Start Date & End Date: The dates that are entered through these filters will coincide with the Previous Years(s) OR Previous Consecutive Periods that are chosen.
3. Previous Year(s): Will only look at the last years of your business growth during the time range you choose. It will also take into account the Number of Years you have chosen.
Example: Date Range is June 1st - September 30th, chose "Previous Year(s)", Number of Years is 3
You will be shown the revenue from June 1st - September 30th this year, last year, and the year before that.
4. Previous Consecutive Period(s): This will run the report for back-to-back time periods based on the date range that you choose
Example: Date range is September 8th - September 14th (7 days), chose "Previous Consecutive Period(s)", Number of Periods is 9.
It will show me September 8th - September 14th, September 1st - September 7th, August 25th - August 31st, and so on to show you 9 of those period spans in a row.
5. If you would like to see a specific employee's revenue, choose them from the drop-down
6. Once the time frames are chosen, move onto choose the data you'd like to include:
7. Click Run Report
- “I Need it now” will run the report immediately and display it on your screen/page as long as you do not exit out
- “I can wait for it” is designed for generating the report, (even if you exit from the page), then saving it to the saved reports folder in the top, right corner of your main Reports page.
Sales Growth Analysis Graph
This report will include a graph that is intended to assist you in visualizing the trends in each type of sale. When looking at the graph you can choose to remove a sales filter from the set of data. Simply click on the sales filter that you want to remove from the graph within the color key. This will draw a line through it to let you know it is not included in the graph.